Flow
Network Engagement Patterns
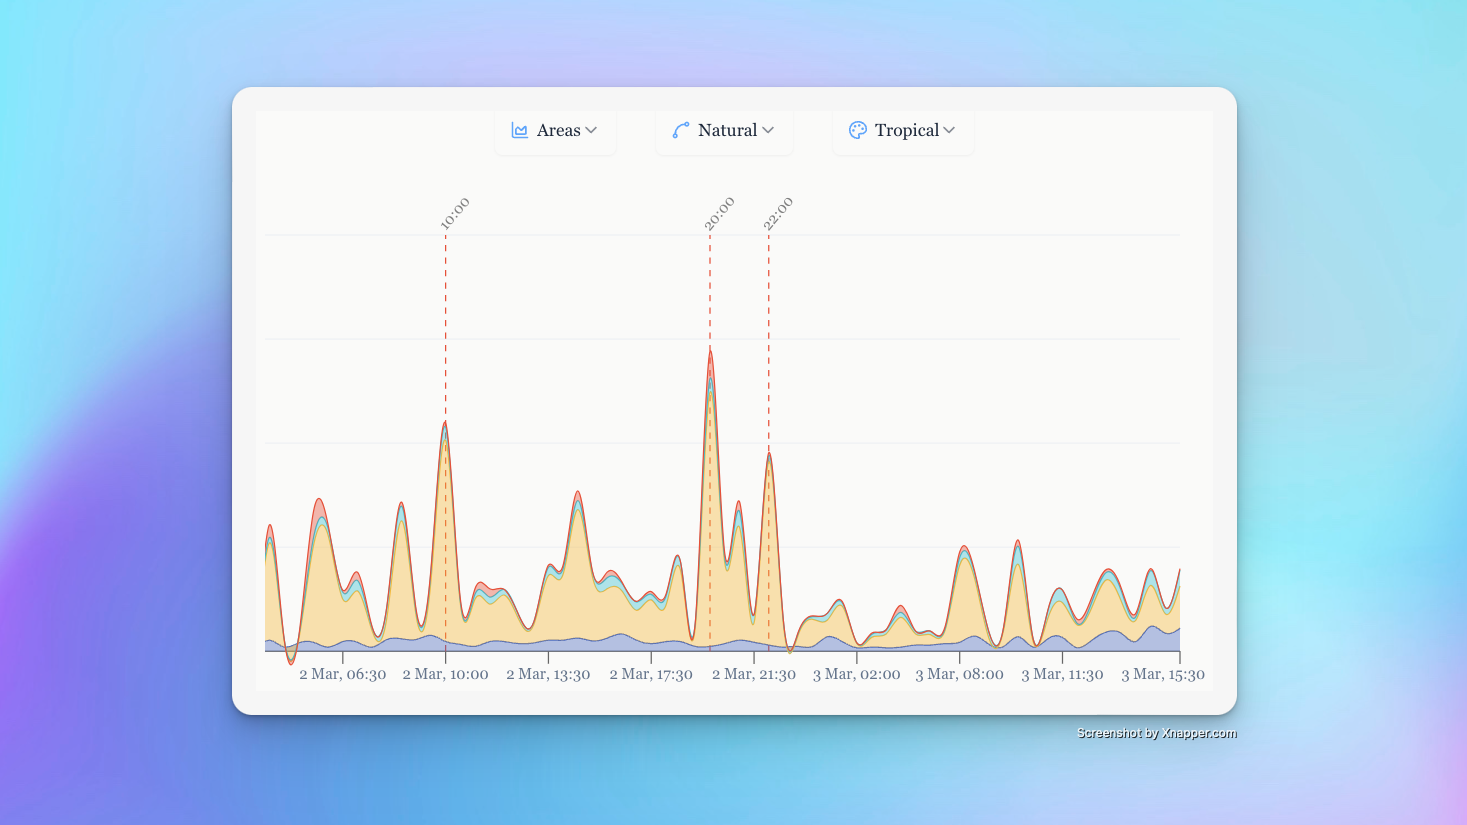
Flow visualizes posting patterns and engagement trends across your Bluesky timeline, helping you understand when and how your network interacts with content.
Skyflow performs this time-based analysis for you by:
- Collecting posts from your timeline
- Sorting them by timestamp
- Grouping posts into 30-minute time intervals
- Analyzing the volume and engagement in each time slot
- Creating a visual map of activity patterns that highlights peak engagement periods
Following vs. Mutual
Flow now includes a filter to toggle between viewing all followed accounts or only mutual connections, offering a number of advtantages:
- See when your mutual connections are most active
- Identify optimal posting times for your core audience
- Compare engagement patterns between your full network and reciprocal relationships
This targeted view helps you better understand when the people who actually follow you back are most engaged.
Note: The Following vs. Mutual filter only appears when there's enough data to differentiate the two. If all the accounts you follow also follow you back, the filter will remain hidden.
The Flow Advantage
Flow simplifies your Bluesky experience by helping you:
- Identify the most active times on your timeline.
- Discover optimal posting windows for maximum visibility.
- Understand your network's daily rhythm.
- Plan your own posting schedule for better engagement.
- See how content distribution varies throughout the day.
- Engage with your network's activity cycles.
Understanding Your Flow
Skyflow presents your Flow in 30-minute intervals in order to smooth out random fluctuations while still capturing meaningful patterns in posting behavior. This visualization shows you post volume by time period, engagement density at different hours, relative activity levels throughout the day, and even day-over-day comparisons with Flow History (coming soon). By highlighting the most active periods, Flow helps you discover the natural rhythm of your Bluesky network.